


Why
When people feel sick, most of them will search for the symptoms on Google. However, these symptoms can lead to results for something common, like a cold or something terrible like cancer.
Google did not reveal the connection between the symptoms and diseases and only gave people the most attractive answer. And for the most part, that could be cancer.
does every Google search for a patient's symptoms lead to information about cancer?

Discover the connections between symptoms and disease and provide more accurate information to educate people before they get professional advice.
I found several datasets related to the symptoms and diseases and did research to reveal the insightful information.
What is the way to reveal the relationship between severity and symptom, or even more, the relationship between severity and disease.
How do we predict the potential symptoms and precautions based on the related symptom/disease.
How do we inform the people who have the chronic diseases the potential risk symptom and the precautions of the disease.
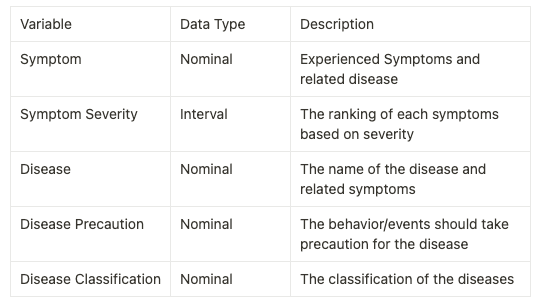
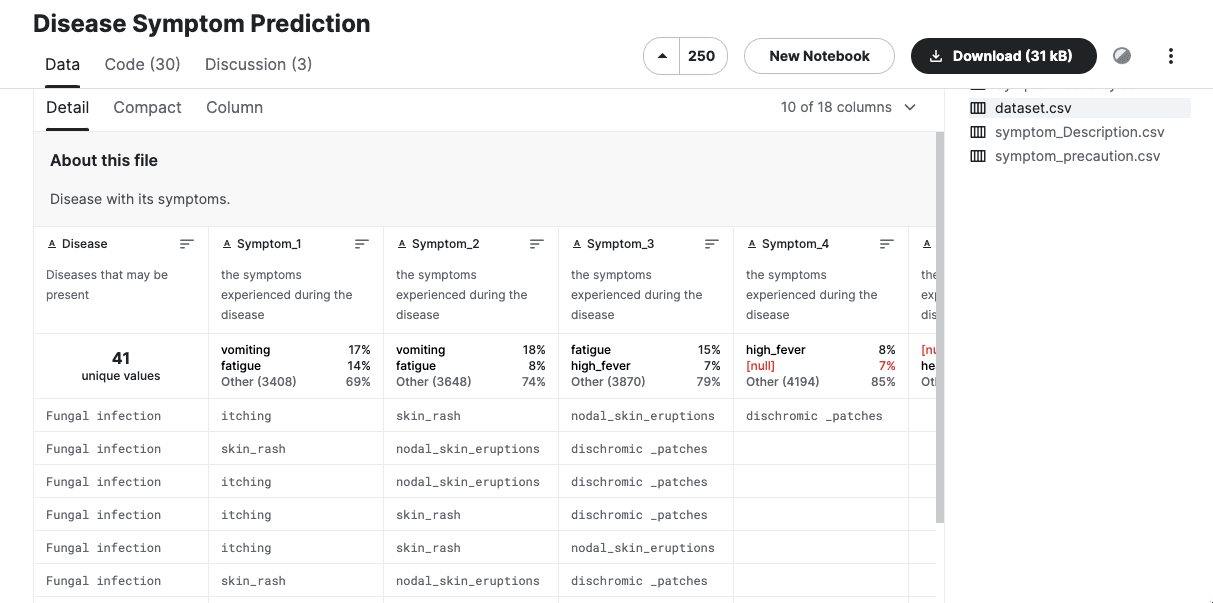
I used the “Disease Symptom Prediction Dataset” to explore the data visualization, which contains most of the details that the users want from pre-diagnosis disease.
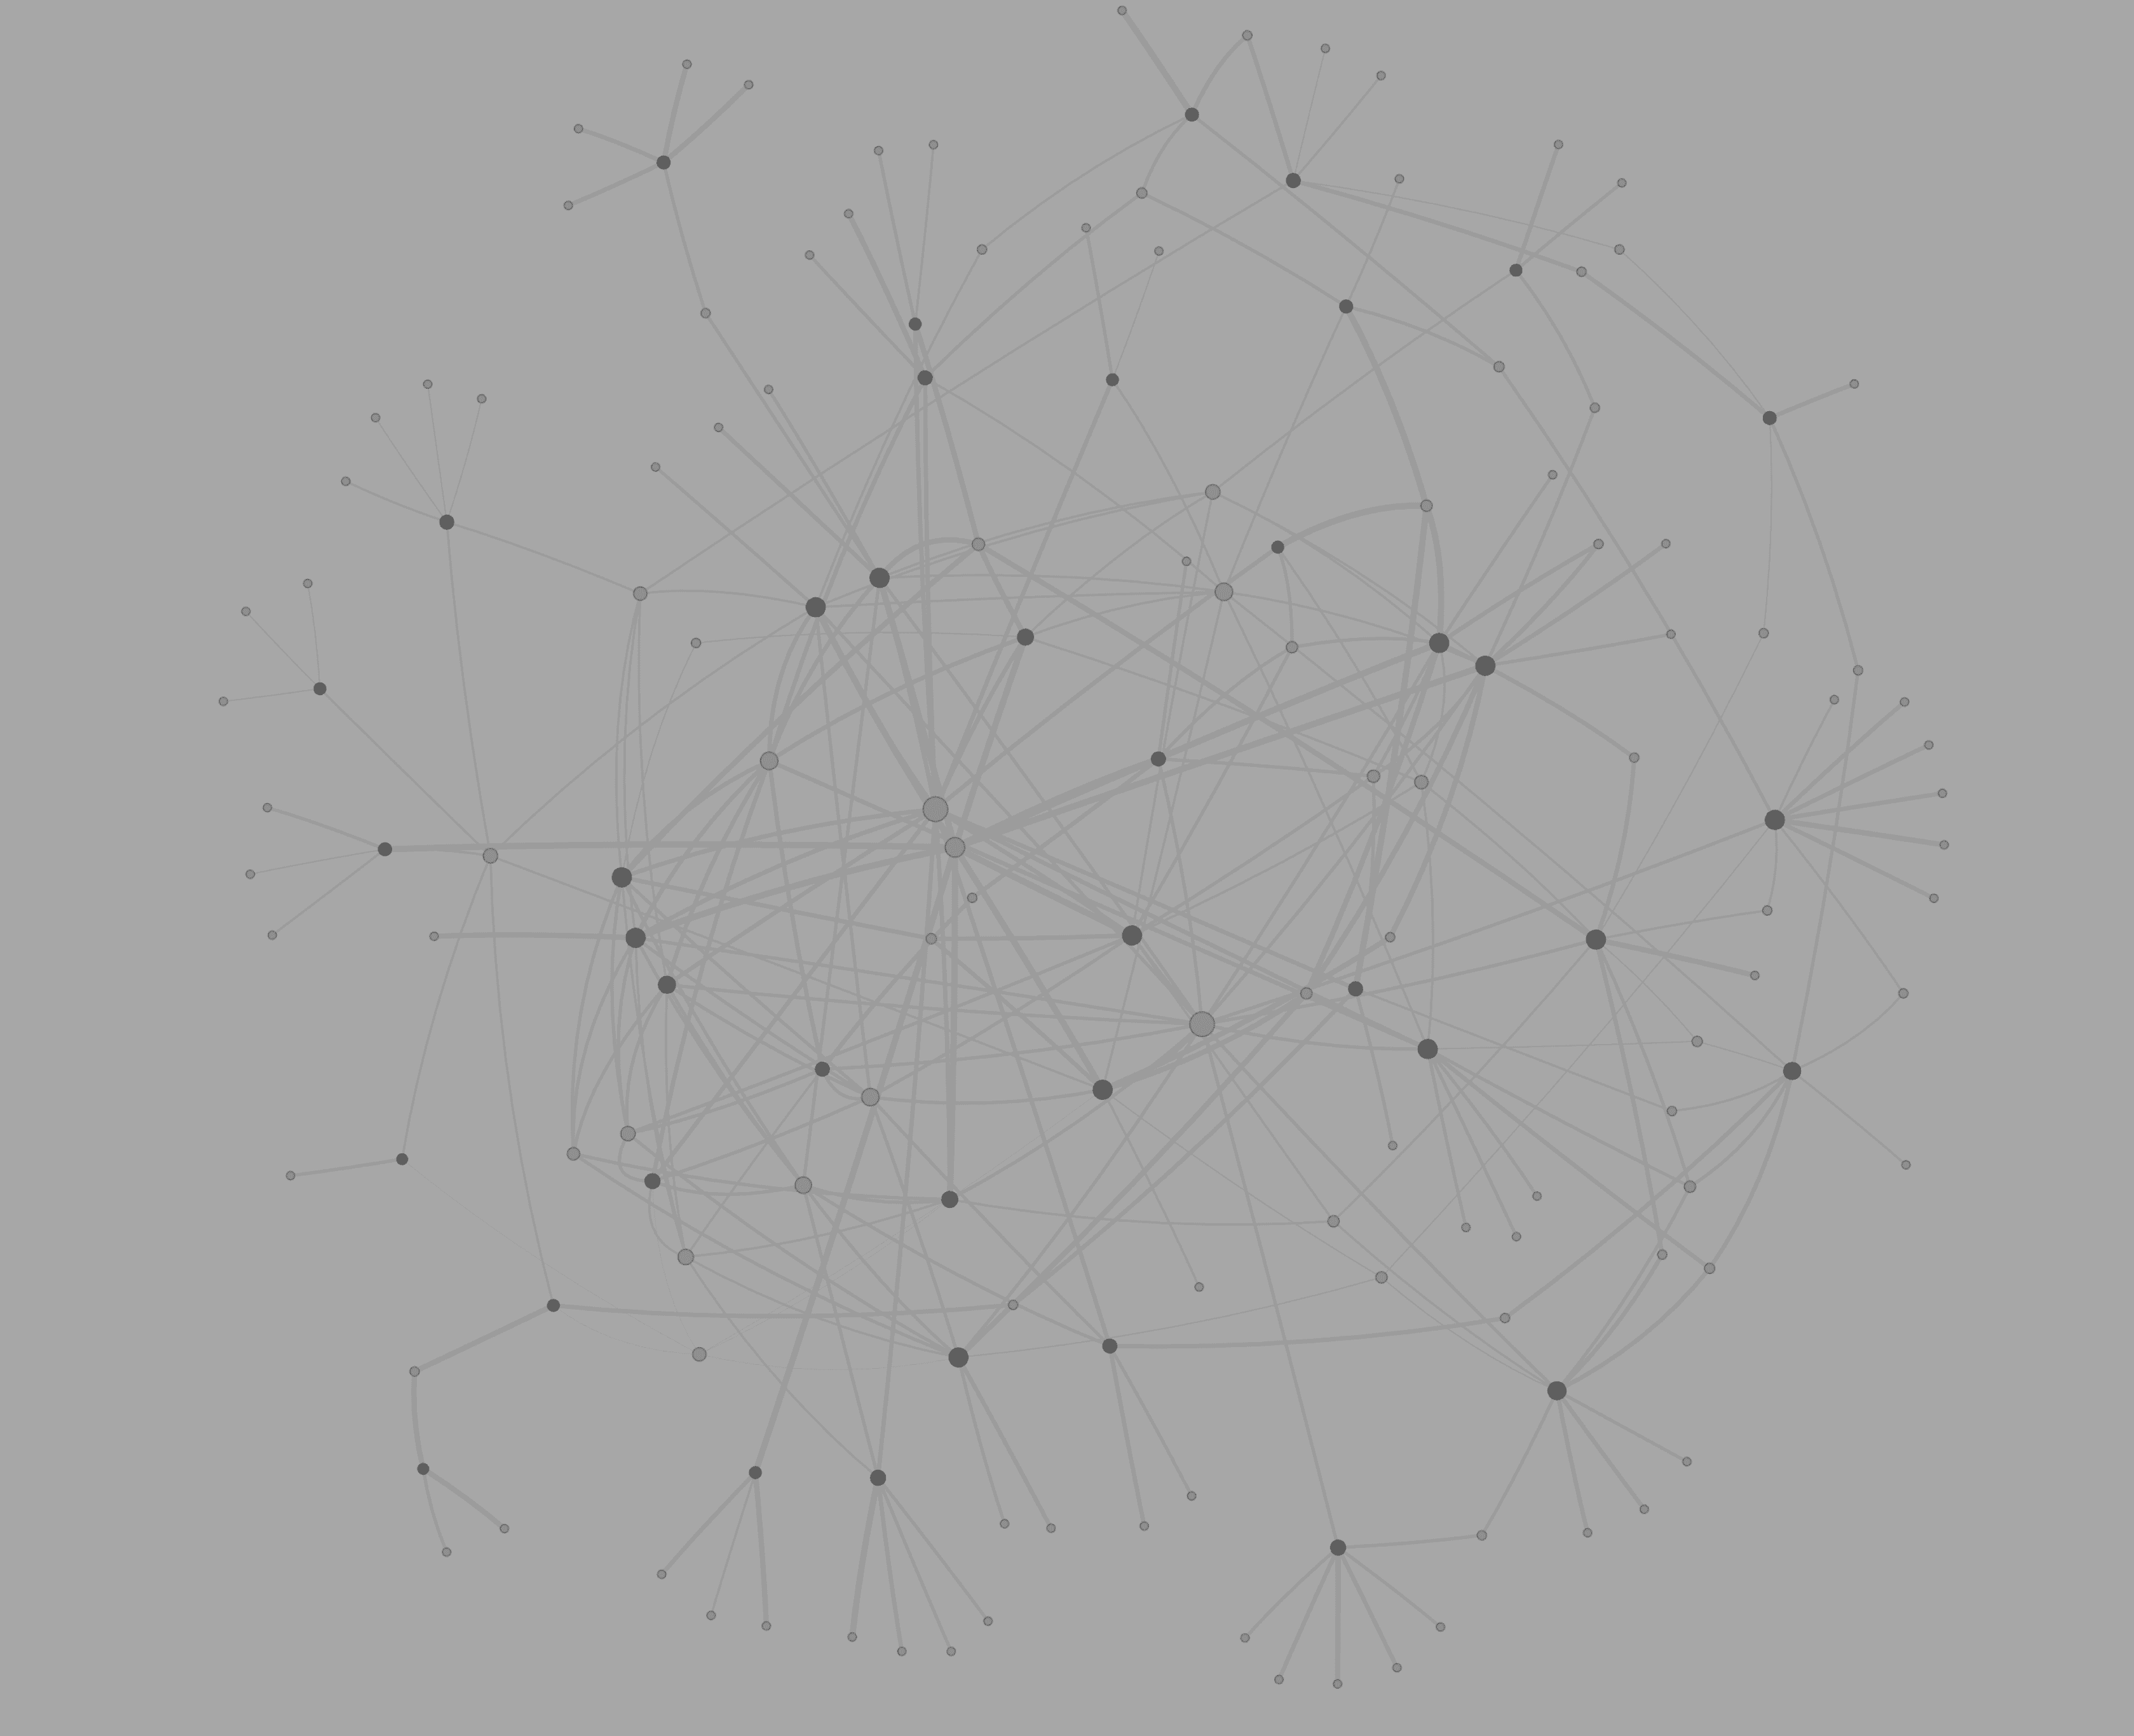
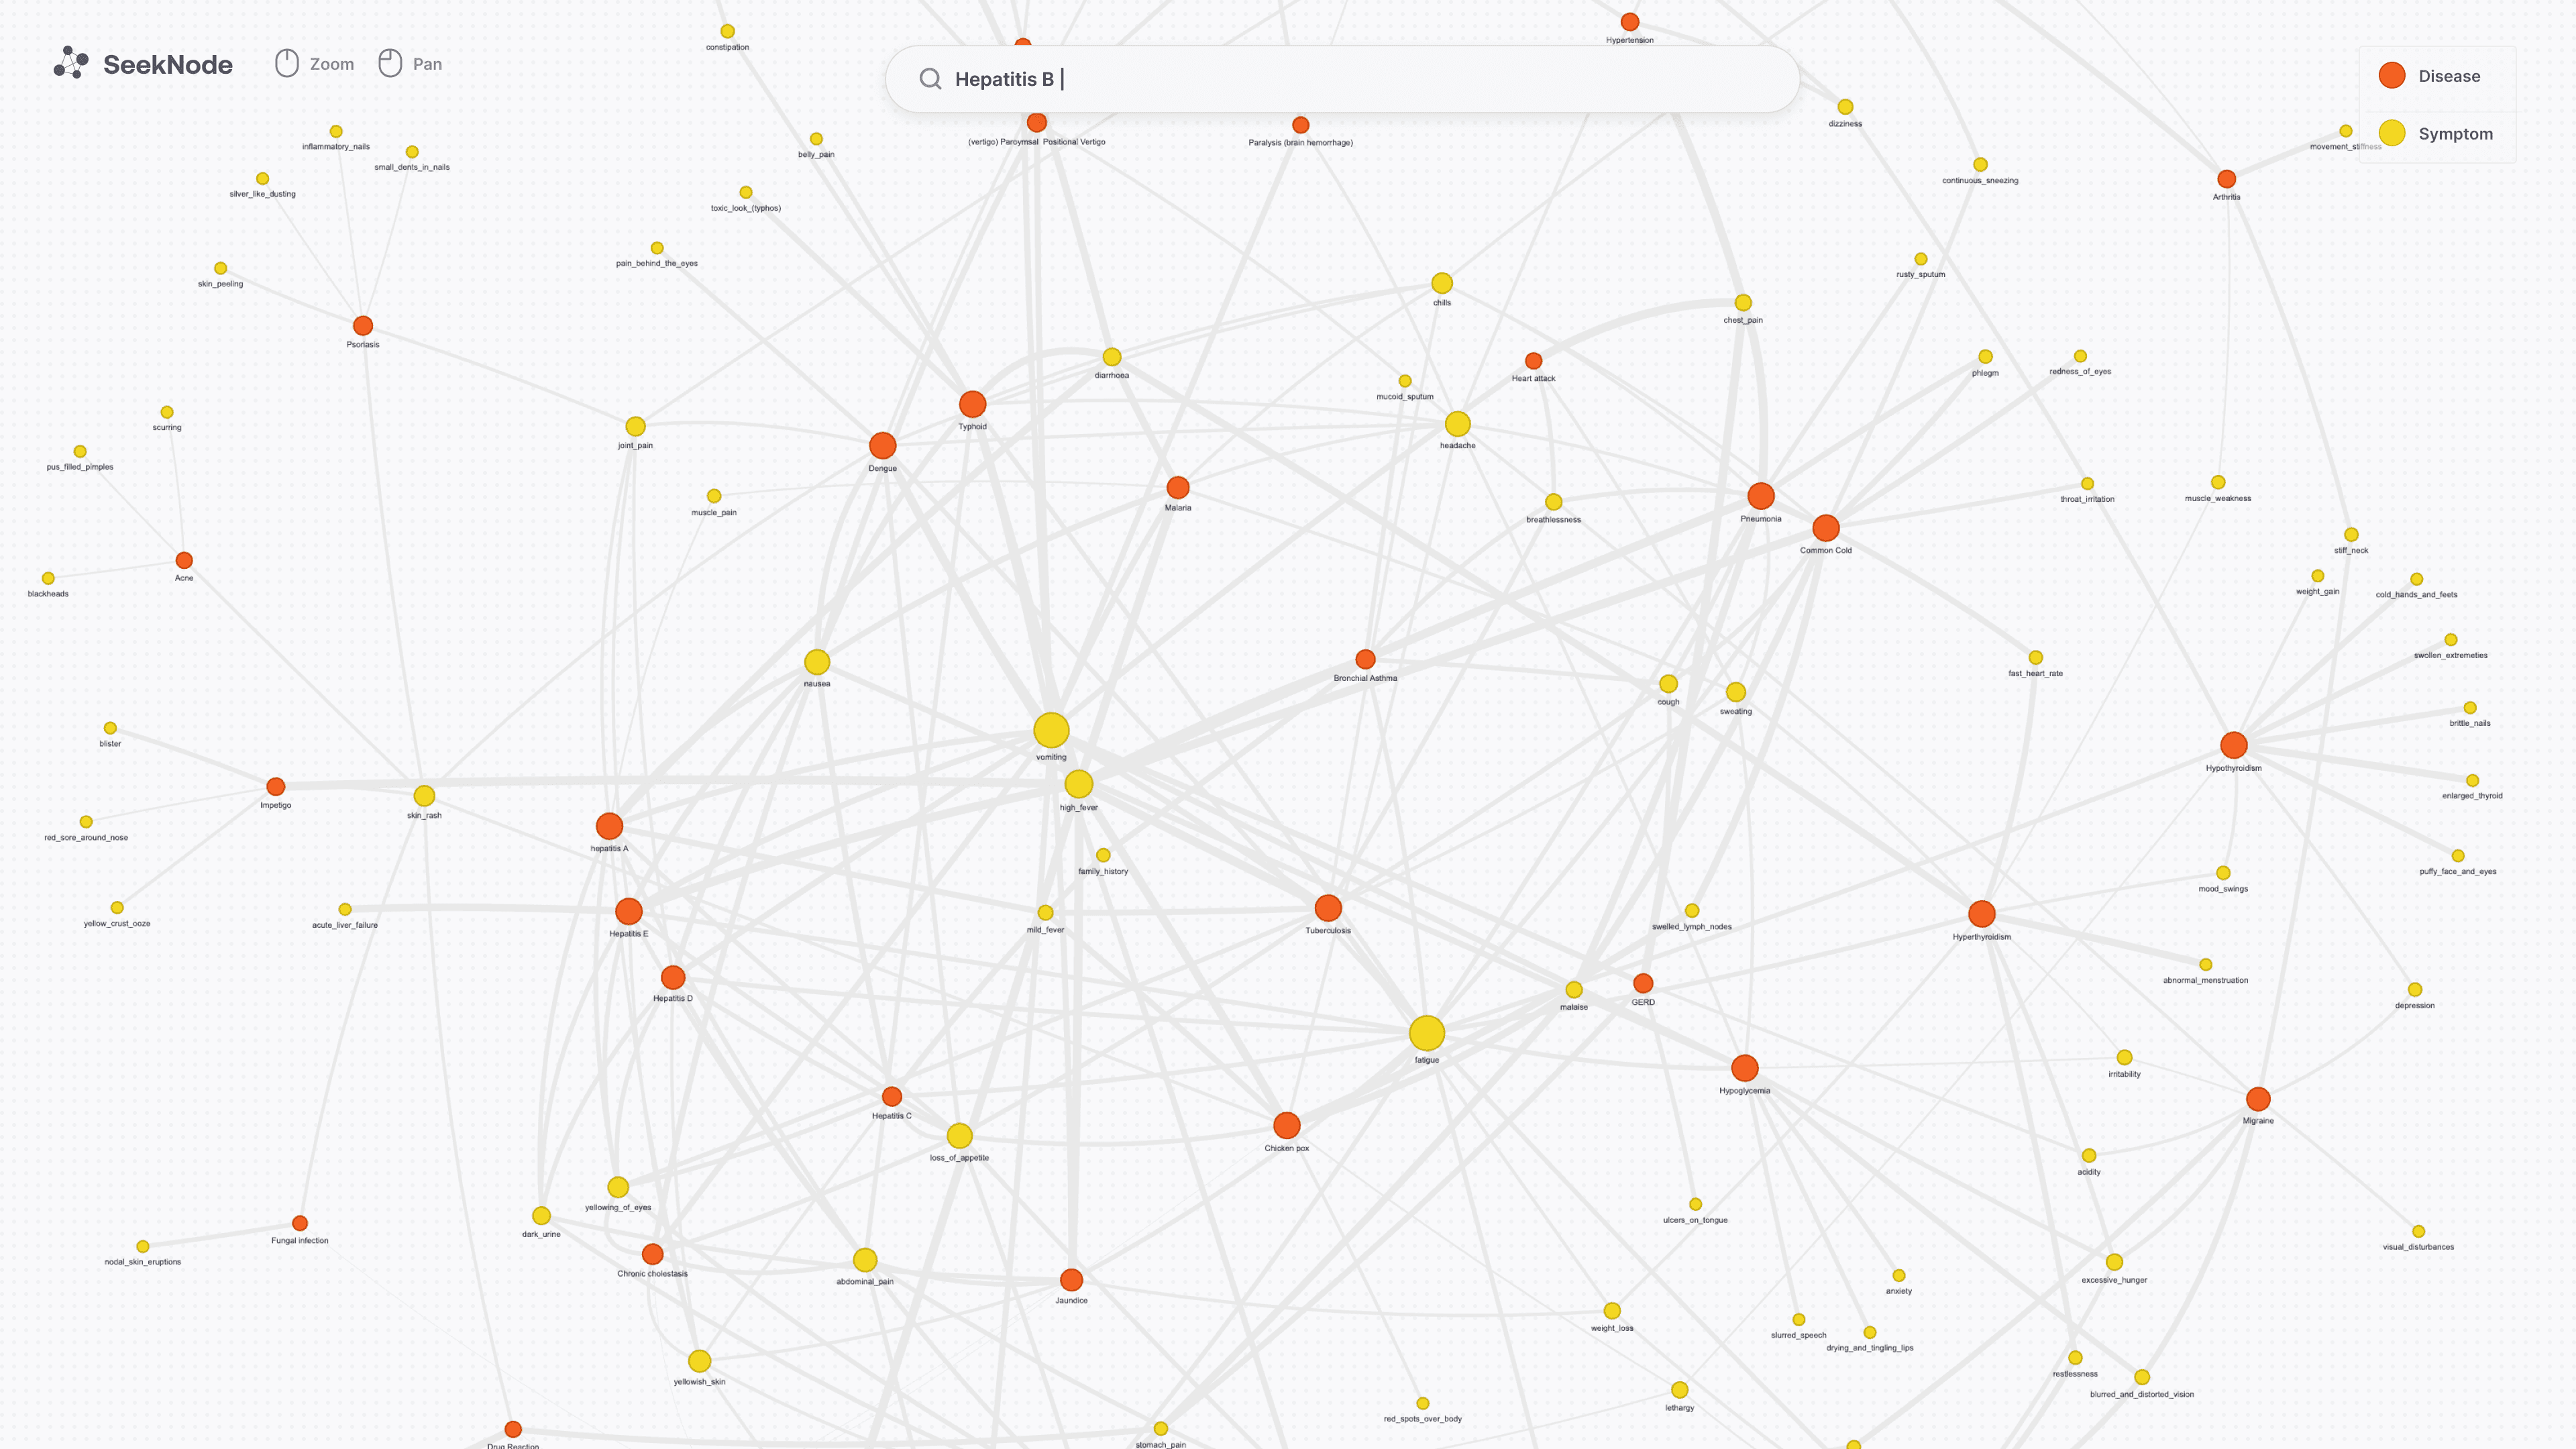
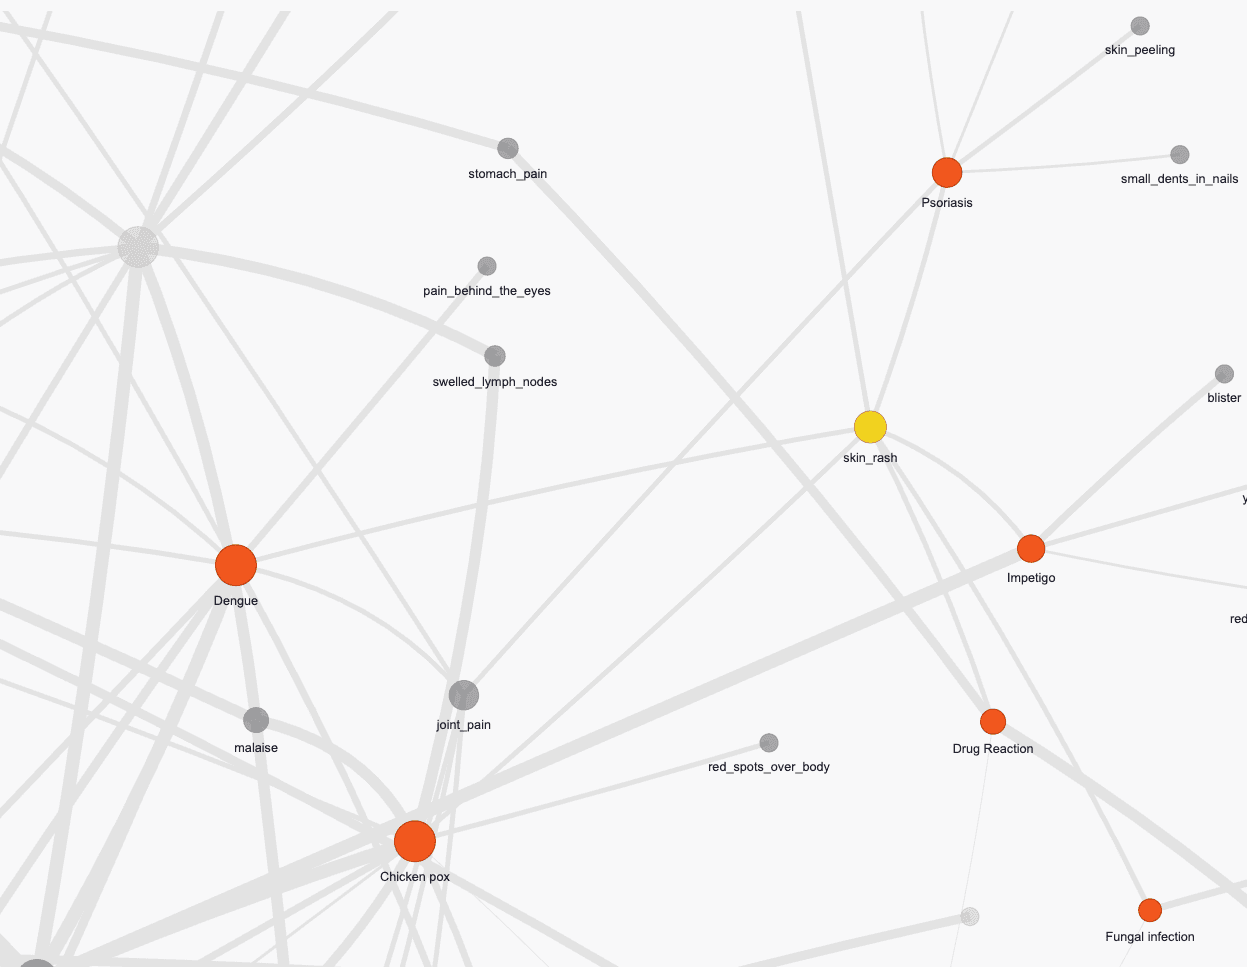
-Disease Database Network
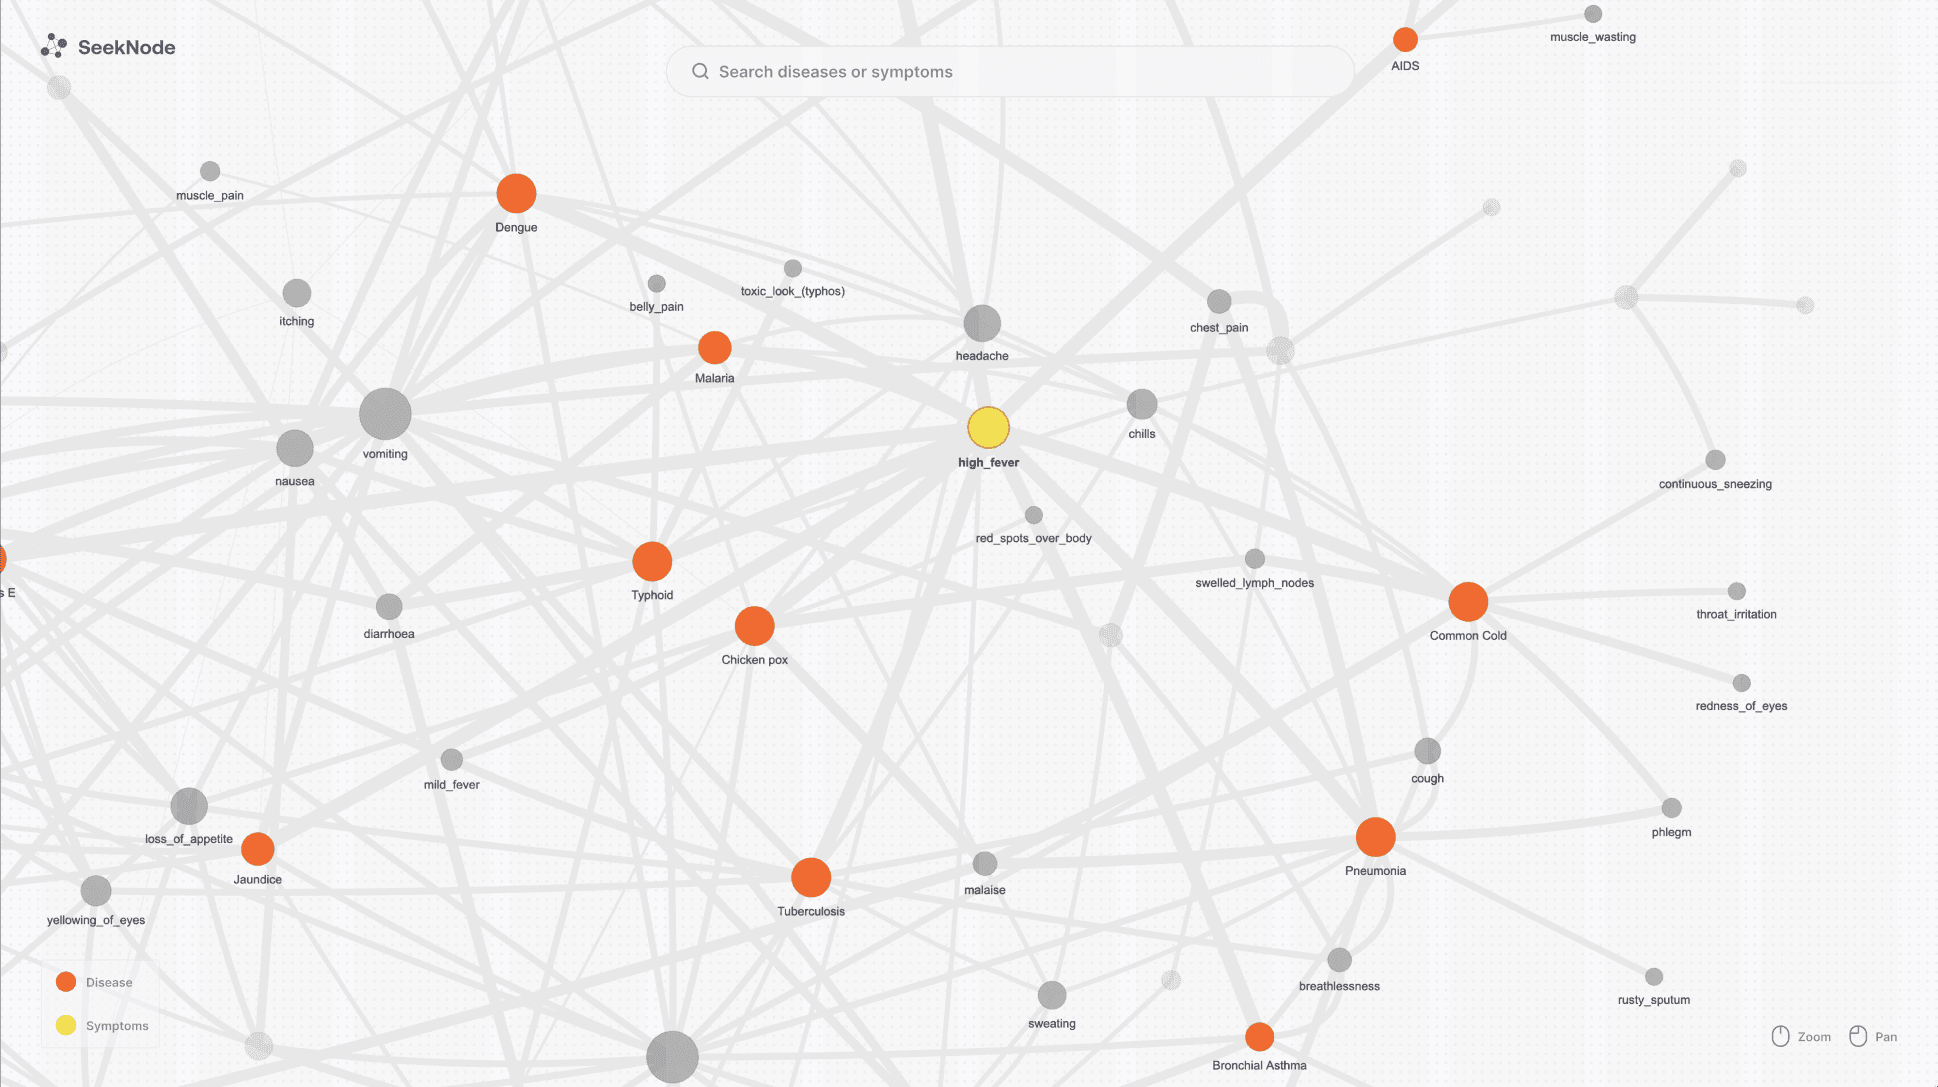
I uses Python + PyVis to created a interactive diagram that reveals the connections of the diseases and symptoms.


-Disease Database Network
(With Severity)
I uses Python + PyVis to created a interactive diagram that reveals the connections and severity of the diseases and symptoms.
-symptom&disease distribution
I used Tableau to created a interactive diagram that shows the distribution of different symptom severity in each diseases in candlestick chart.
-symptom&disease severity chart
I uses Tableau to created a interactive diagram that shows the distribution of different symptom severity in each diseases in stacked bar chart.


https://haoranx.notion.site/Test-template-cae8ff6c3be44696a67ee44a26f8eacc
& test procedure
You are now feeling some pain in your liver with swelling of stomach, try to identify the possible disease and its severity. (you got a fever, feels fatigue)
You've been suffering from alcoholic fatty liver disease, but you don't know how to take care of yourself in life and what constitutes a dangerous symptom. You want to find out the precaution of alcoholic fatty liver and what the severity of the symptoms are.
1 = Cosmetic problem only: need not be fixed unless extra time is available on project
2 = Minor usability problem: fixing this should be given low priority
3 = Major usability problem: important to fix, so should be given high priority
4 = Usability catastrophe: imperative to fix this before product can be released

How Do Professionals Diagnose and What Is the Problem With Normal People Using It That Way?
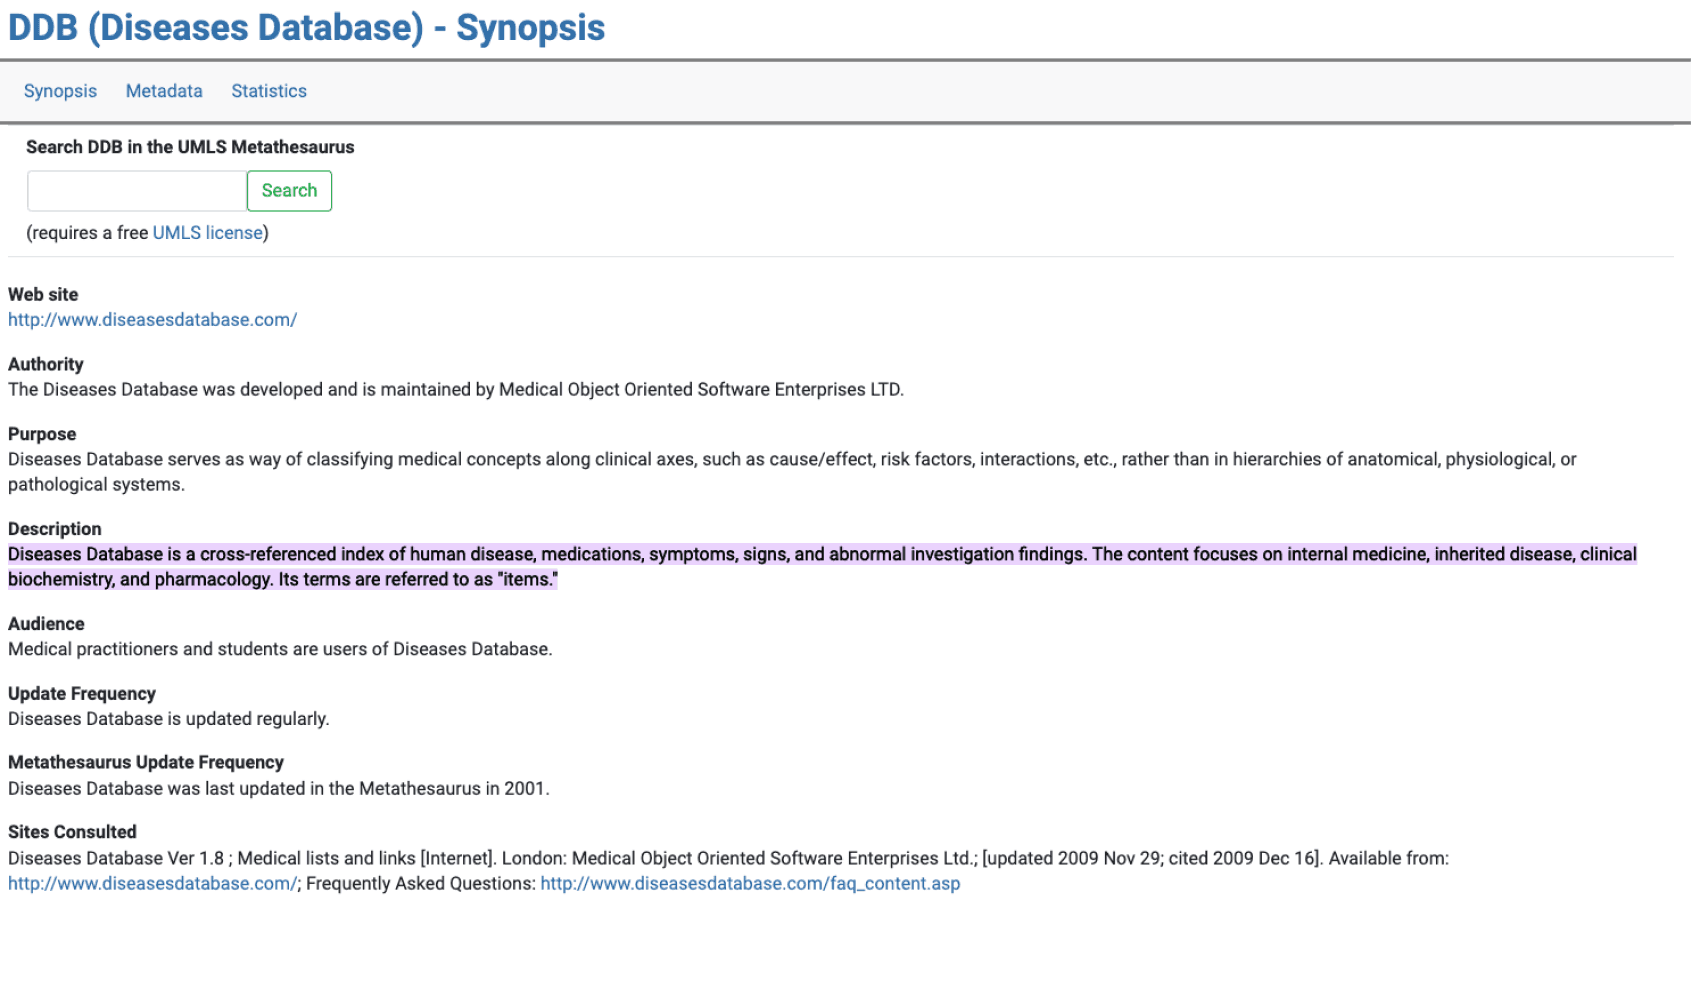
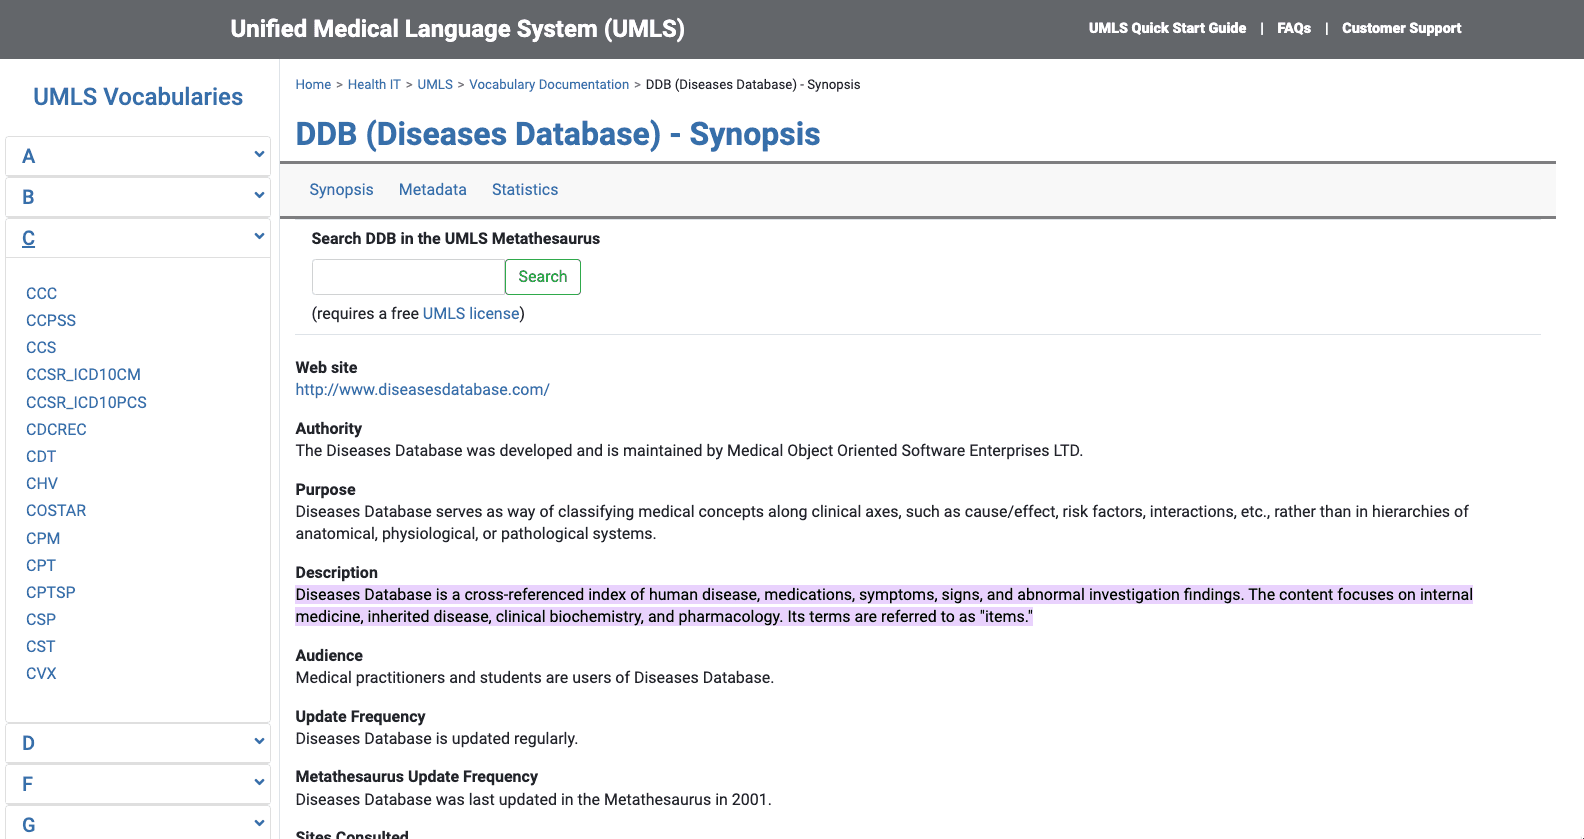
Based on secondary research, most of the professionals working in the medical industry use the Disease Database to search for precise information and connections between the Disease and its symptoms.
However, most of the Disease Databases are extremely complex and not intuitive to use.
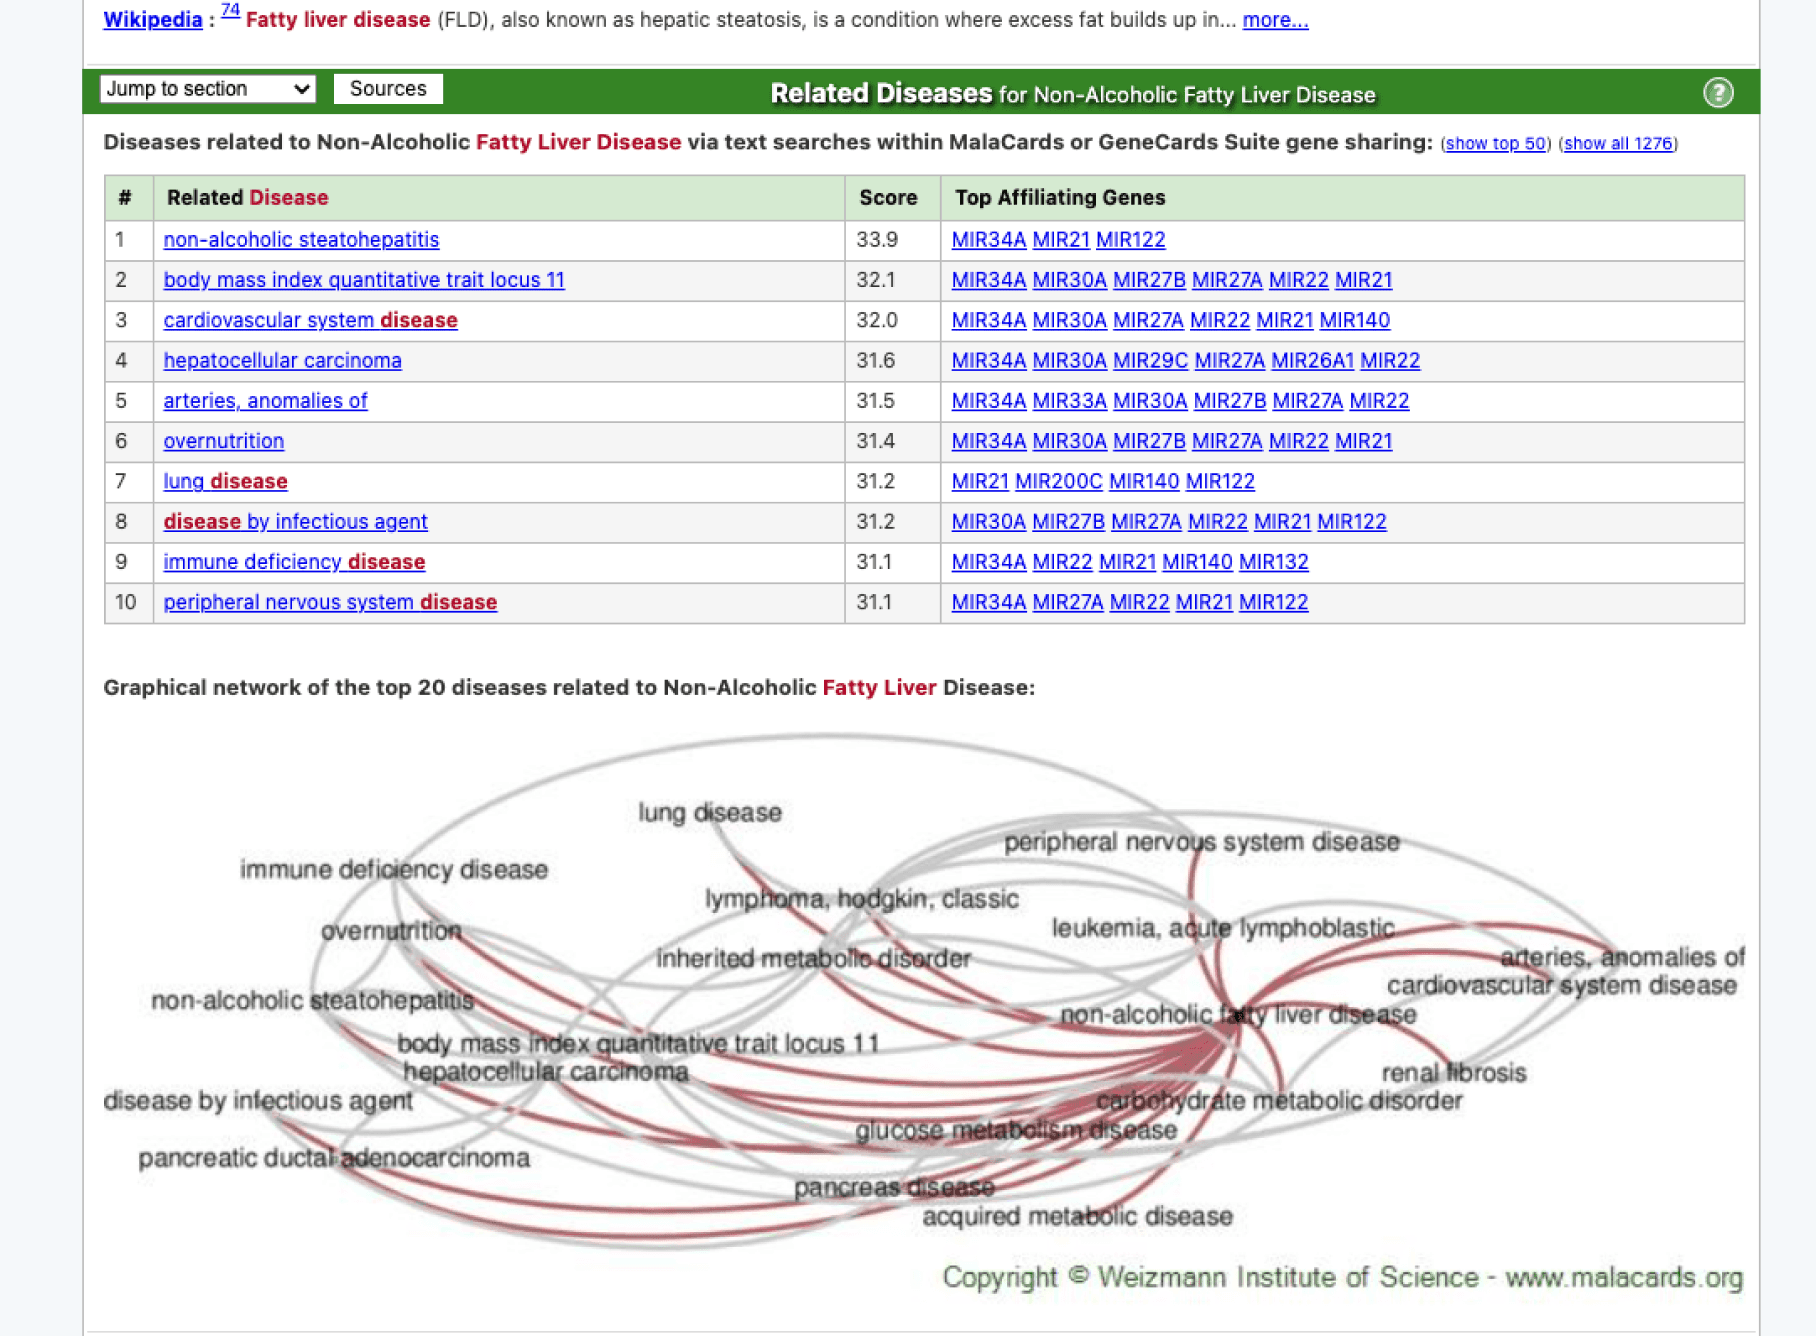
https://www.malacards.org/
https://www.nlm.nih.gov/
https://disease-ontology.org/
http://www.diseasesdatabase.com/

Daniel can easily understand the relationship of the current symptoms and the related/possible diseases from the graph.
I highlight the selected node and its connected node in order to help people quickly filter the information.
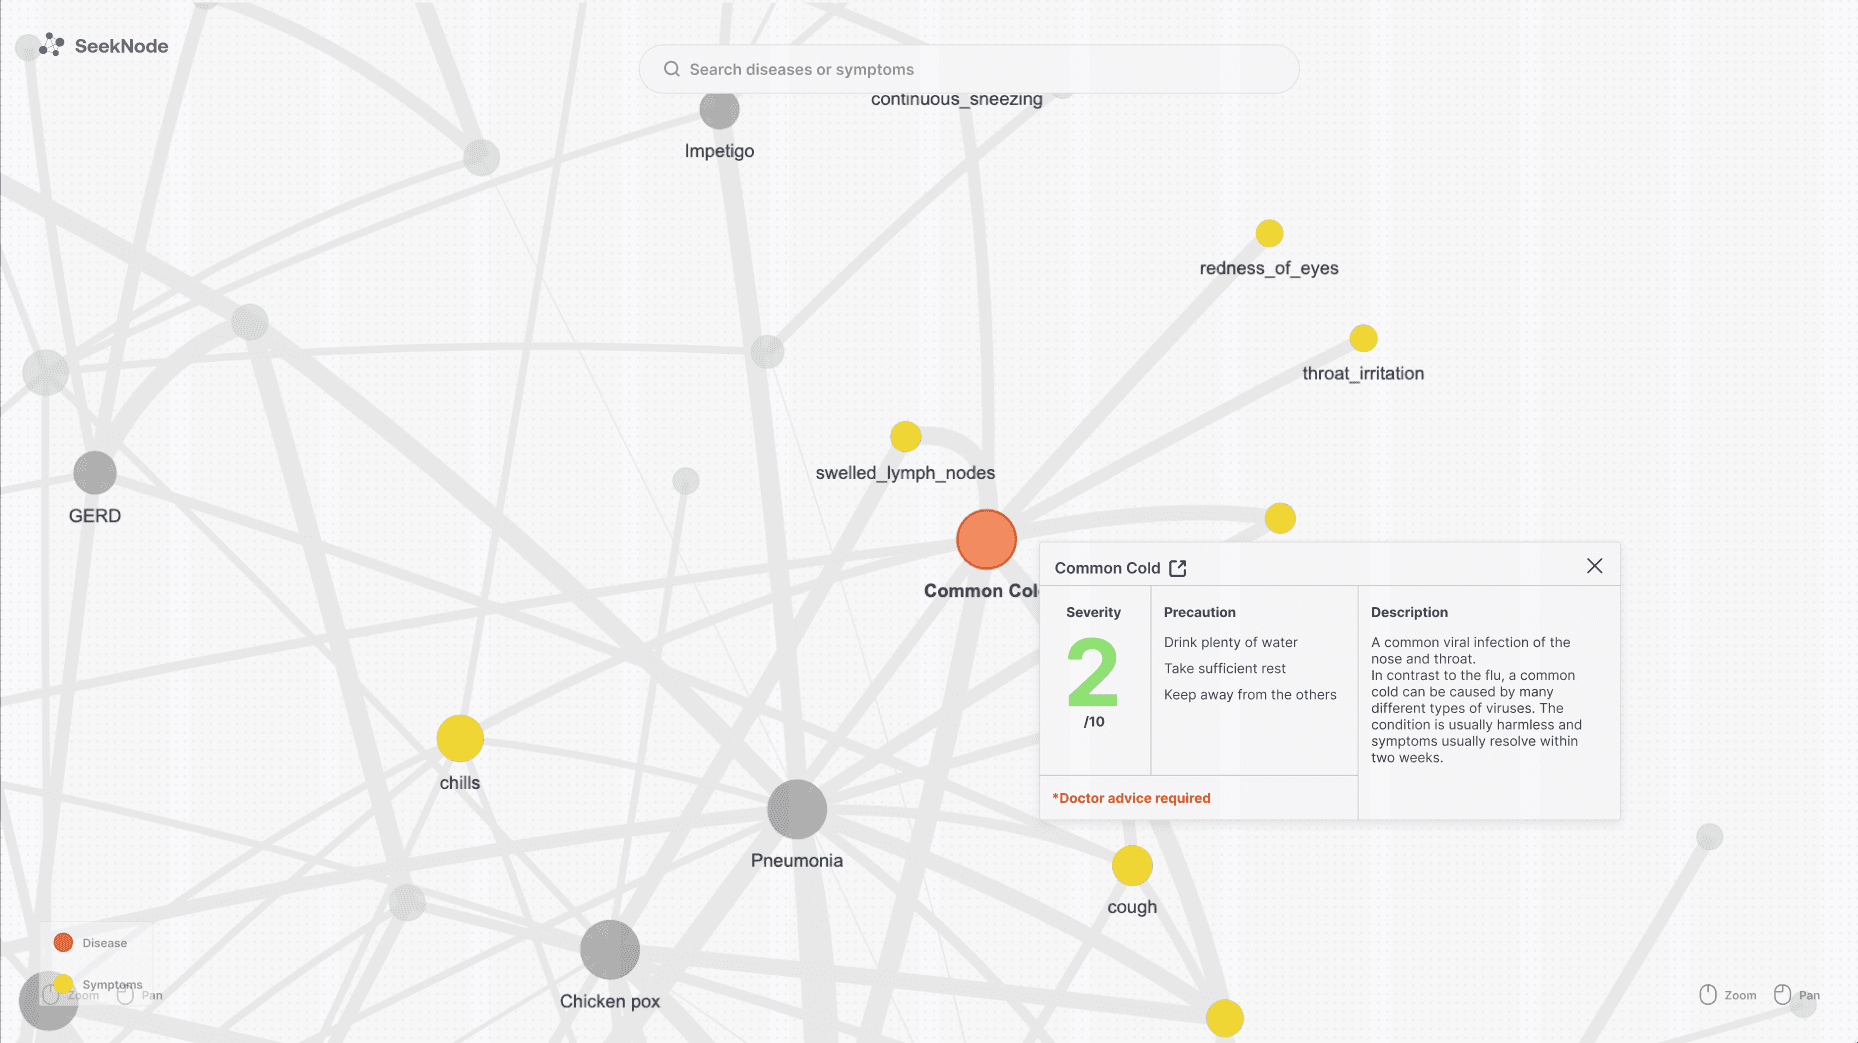
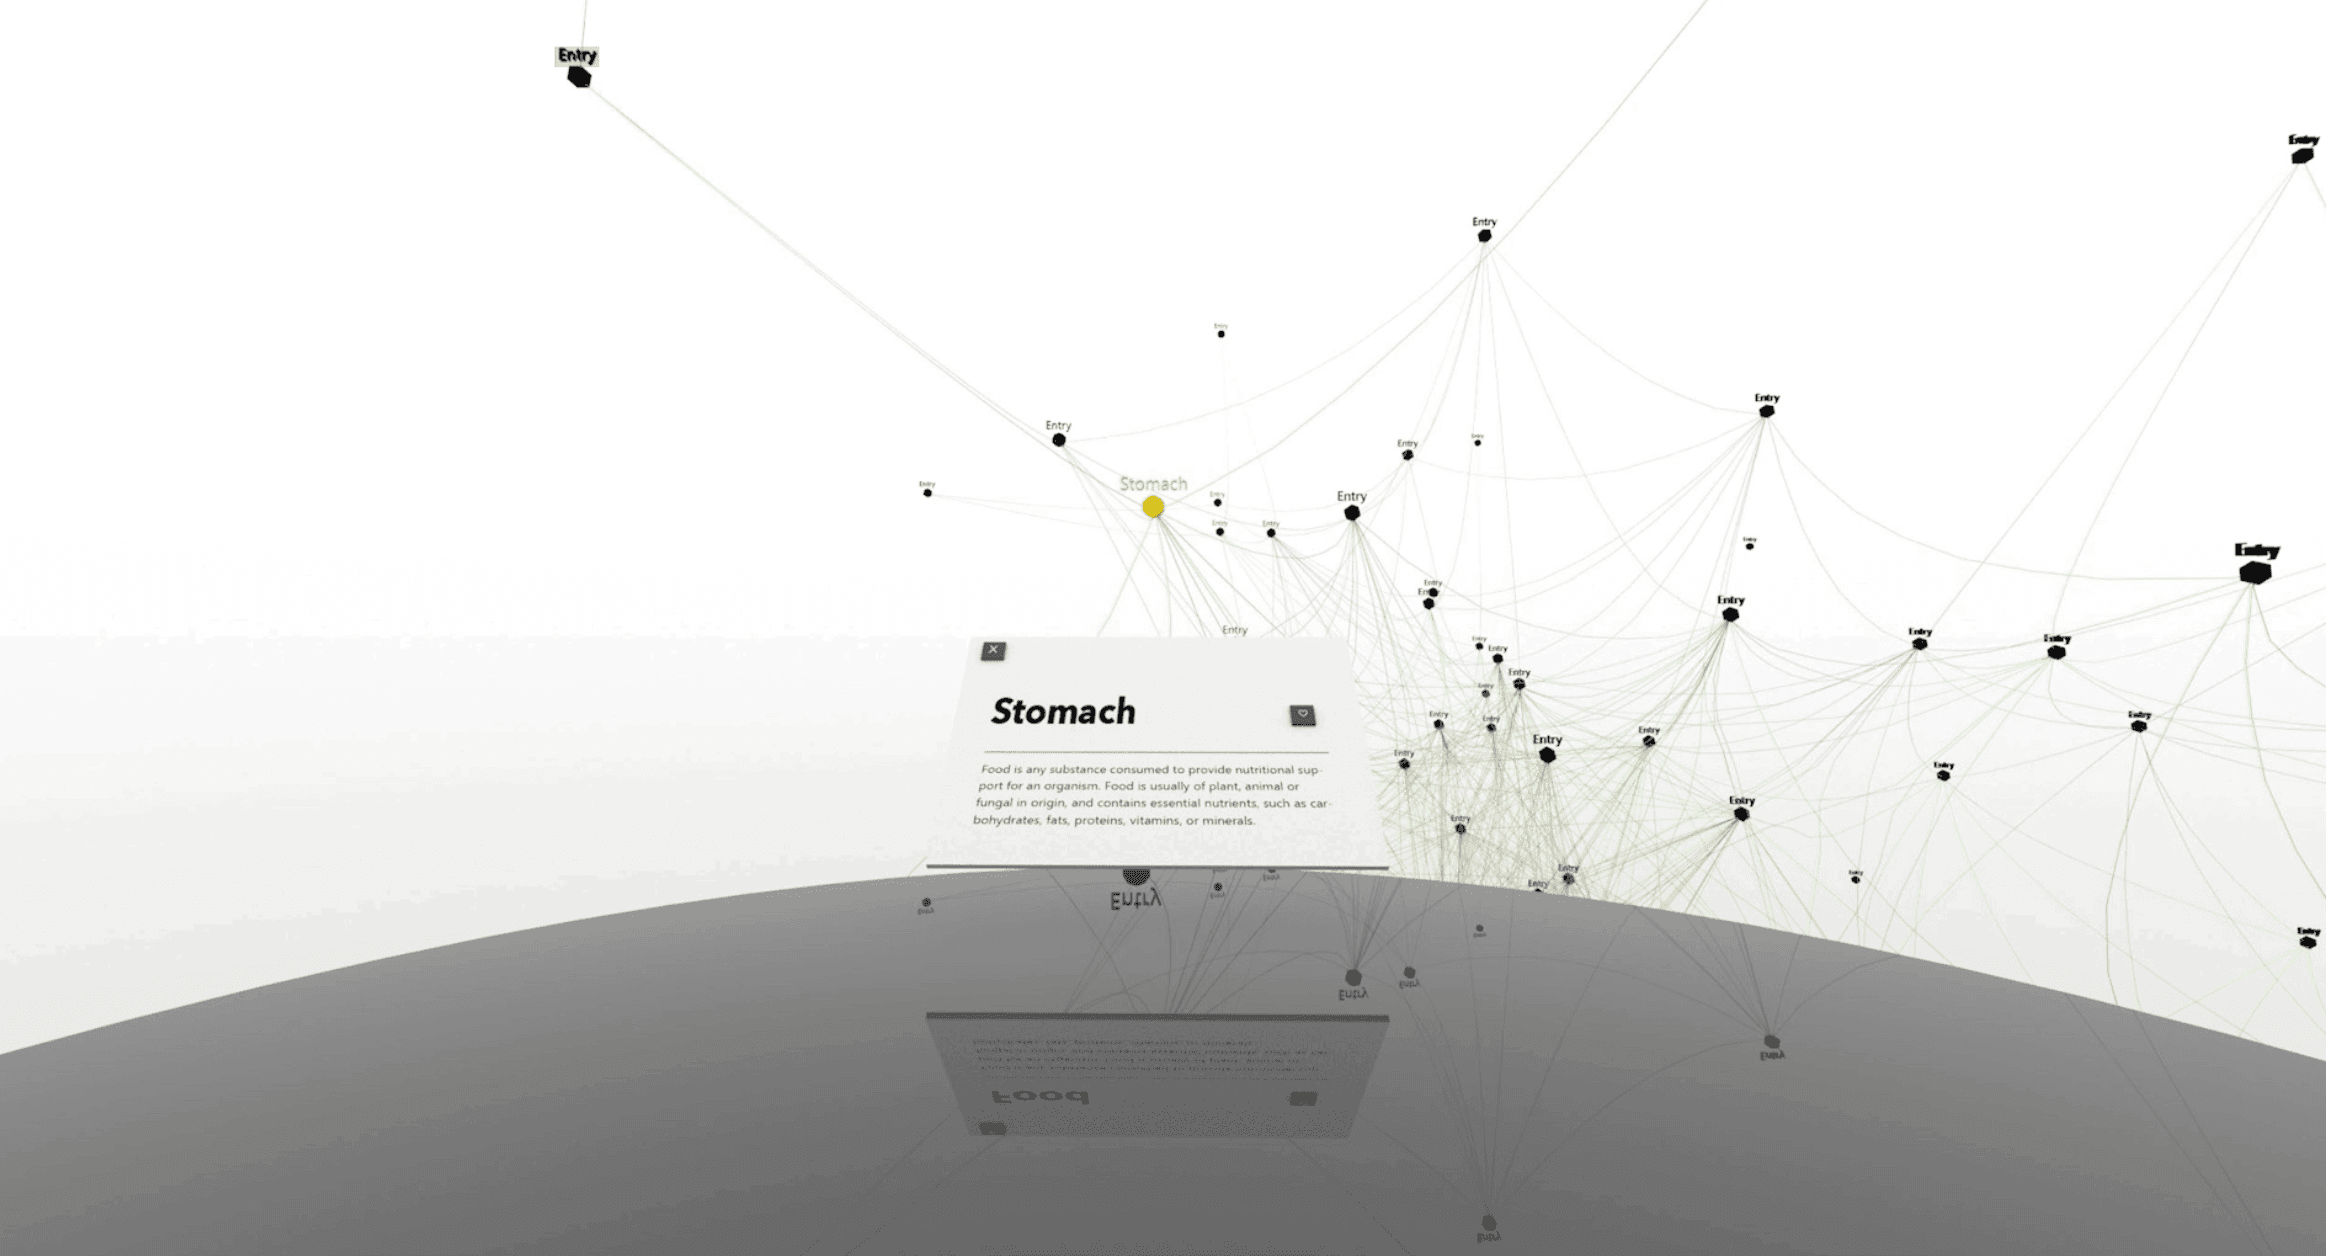
Daniel can quickly check the severity of the possible diseases related to the symptom with the precaution and the description of the disease. Which can offer the user sufficient information to decide does he need to go to hosipital.
I color coded the severity for the first look. The red text is always been a indicator to remind people for seeking professional advice.
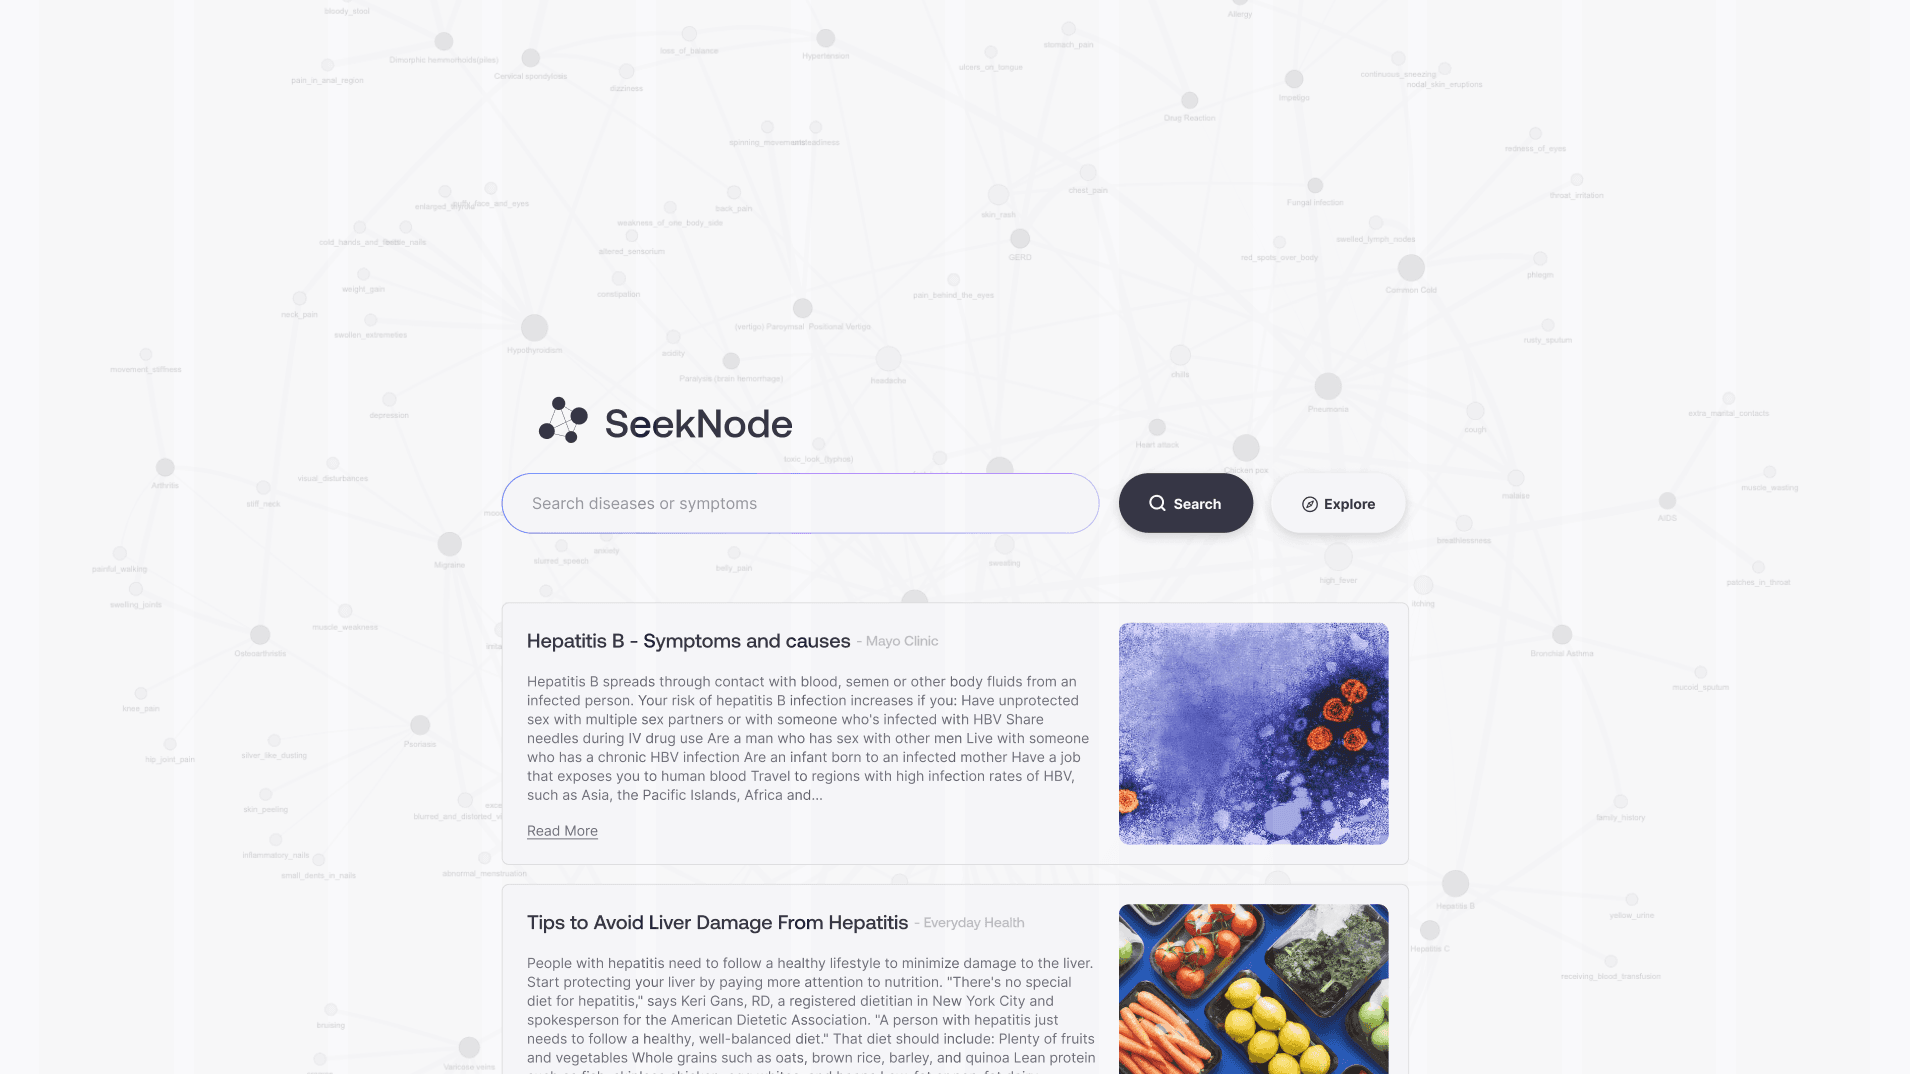
SeekNode to feed the Galvin what they should take care of based on his search history.
I implement this feature since it will help people with the existing disease gather more information.
Galvin can search the disease he have for quick access.
For the patient who already know the disease but just want to discover the symptoms, the searchbar can help them.

Galvin can found out what is the specific symptoms indicates for the disease he got.
The feature can help the users to know the context of the symptom towards a specific disease.
Defining the user, or patient, of the product based on previous research.
Imagining a new way of designing the search engine, which not only give people the answer but also give the context and the connections of the knowledge to the people.


The project is open-sourced with GNU License on Github


© Copyright 2024 • All Rights Reserved
hi@haoran.io